The report says reach is up. Impressions are up, followers are up, and the open rate has never looked better. The phone rings about as often as it did last spring. If that sounds like your month, the report is not lying to you. It is counting how much the tool was used, which is a different thing from counting customers, and that mix-up is a good deal older than the internet.
We made a short film about it. In The Marketing Time Machine, Ryan and Jessica ride an old cage elevator through 120 years of marketing. Ryan falls for every era he steps into. Jessica brings a clipboard, because somebody has to measure it. The whole trip takes 84 seconds.
The clipboard is the part worth keeping, so the rest of this entry is about what she wrote on it, and what belongs on yours.
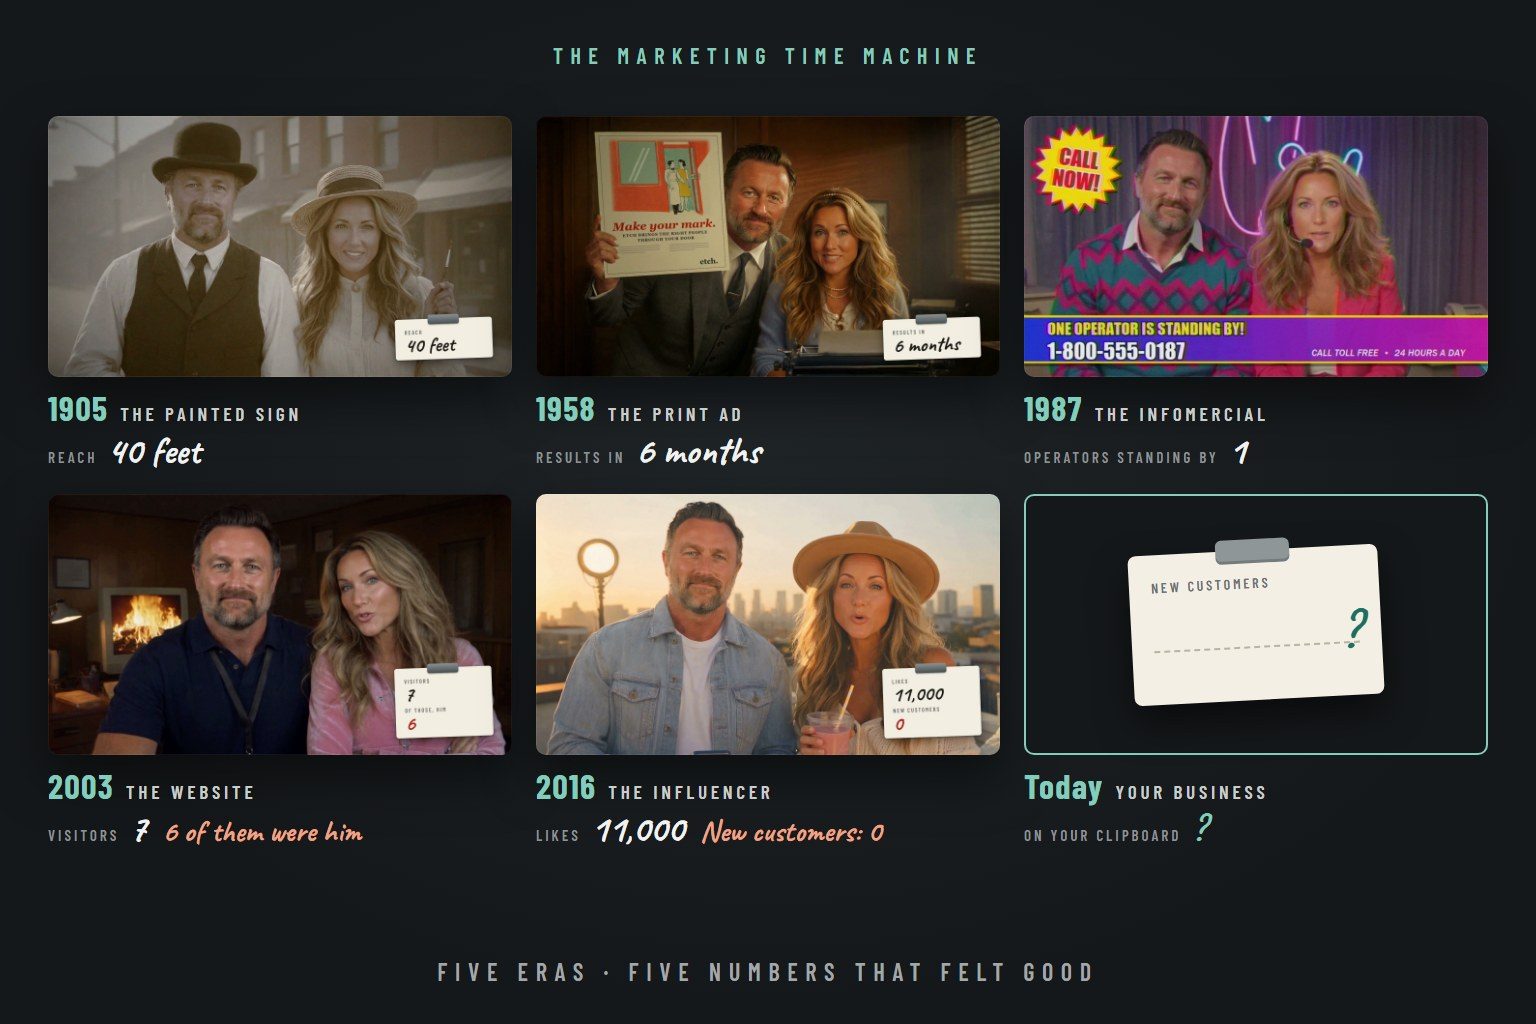
Five eras, five numbers that felt good.
Each stop has the tool everyone was excited about that year, and the number that came with it.
- 1905, the painted sign. Fine goods and fair prices, right there on Main Street. Jessica’s count: total reach of the campaign so far, about forty feet. A sign works on whoever walks past it and on nobody else.
- 1958, the print ad. One perfect headline, then two hours for lunch. Her note: we will find out if it worked in about six months. The work was good. The answer came too late to change anything.
- 1987, the infomercial. Operators are standing by. There is exactly one operator standing by, and it is her. The promise ran ahead of what the business could pick up.
- 2003, the website. Spinning flames and a real visitor counter. The counter says seven, and six of those visits were his. It was the first marketing number an owner could watch move, and mostly it counted the owner.
- 2016, the influencer. Eleven thousand likes and still climbing. Her count beside it: new customers, zero.
Why the easy number always wins.
None of those five numbers is a lie. Forty feet of reach is real. So are the seven visits and the eleven thousand likes. Each one is simply the number the tool hands you for free. A sign has a street. A magazine has a circulation. A website has a counter. A social platform shows you the likes before you have put the phone down.
Customers are harder to count. Someone has to ask each one how they found you and write the answer down. So the easy number goes in the report, and the hard one never gets collected.
The line usually credited to John Wanamaker, the Philadelphia department store owner, is more than a century old: half the money I spend on advertising is wasted, and the trouble is I don’t know which half. He had the sign and the newspaper. We have dashboards. The complaint is the same because the easy numbers are the same kind of number. They measure the step before the step that pays.
This year’s flame website.
Every era in the film believed its tool was the one that changed everything, and each was partly right. This year’s tool is AI, and it arrives with its own counters: questions the chatbot answered, posts written this month, emails sent without anyone typing them.
We use it every day. The film itself was made with it. The two people on screen are AI look-alikes of us, speaking lines we wrote and recorded in our own voices, and it was finished in days by two people with full calendars. So this is not an argument against the tool. It is a note about the tool’s numbers. A chatbot that answered four hundred questions has told you nothing yet about bookings.
Some of the old counters have also stopped meaning what they used to. Since September 2021, Apple’s Mail app has offered Mail Privacy Protection, which loads a message in the background whether or not anyone reads it. Each of those loads is recorded as an open. An open rate that jumped that autumn did not mean more readers.
What to write on your own clipboard.
Jessica’s clipboard asks the same question in every era. Yours needs five lines, and all five can be counted by hand.
- New inquiries. Every call, form, text and walk-in from someone who is not yet a customer, counted in one place each week.
- Where each one came from. Ask every new person how they found you, and write down what they say.
- How fast the first reply went out. Minutes on a good day. If the honest answer is the next morning, fix that before you buy more reach.
- New customers. How many of those inquiries paid you for something.
- Who came back. Second visits and repeat orders, because a returning customer cost you nothing to find.
Then do one sum.
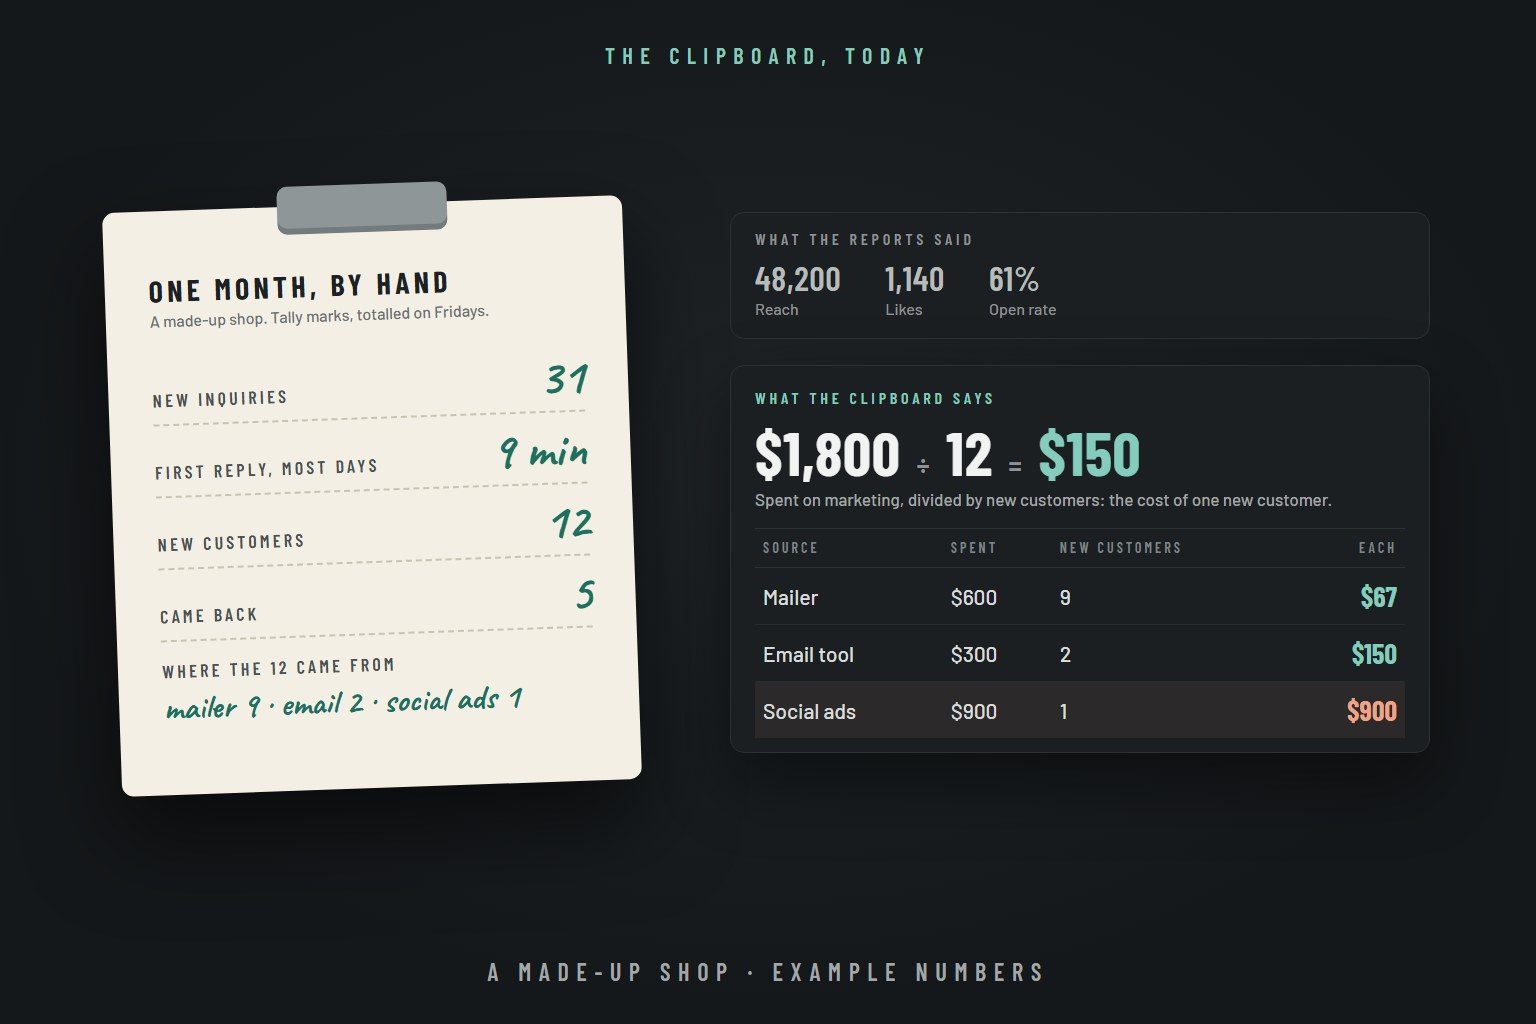
The number that ties the list together is the cost of a new customer: what you spent on marketing in a month, divided by the new customers you gained that month.
Take a made-up shop. Last month it spent $1,800 across its social ads, a mailer and its email tool, and it gained 12 new customers. That is $150 each. If an average first job is worth $400, the month paid for itself. If it is worth $90, it did not, however good the likes looked.
Now do the same sum for each source, using the answers from the second line. The mailer cost $600, and nine of the twelve said it brought them in: about $67 each. The social ads cost $900, and one person named them: $900 for that customer. The last two came from the $300 email tool, at $150 each. Wanamaker never found out which half. This shop just did, with a sheet of paper.
Start this week.
None of this needs software. It needs a sheet of paper by the phone, the five lines above, and four weeks.
- This week. Put the sheet where the phone is answered and where the forms land, and make one person its keeper.
- Every Friday. Total the five lines. Tally marks are fine.
- After four weeks. Lay the sheet beside the reports your tools and vendors send. Where a report went up and the sheet did not move, you have found a visitor counter.
- From then on. When anyone shows you a number, ask one question: how many of those became customers?
The film ends outside a shop on an ordinary day, with customers walking in. The tools change completely every few years. The job never does, which is getting the right people through your door.
If you would like a second pair of eyes on where your inquiries come from and where they leak, our free checkup looks at your forms, your website, your Google profile and any ads you run, and sends one page back in two business days.